As part of our ongoing focus on continuous process improvement (CPI), this quarter’s column highlights a critical step in any improvement effort: Measure.
Measurement helps us move beyond assumptions and understand how a process is performing. It establishes a baseline, identifies gaps and allows teams to evaluate whether changes lead to meaningful improvement.
What does “measure” mean?
In Lean, the measure phase focuses on identifying a small set of meaningful metrics that reflect process performance. Common examples include:
- Time (turnaround or wait time)
- Volume (number of requests or transactions)
- Quality (errors, rework, or defects)
- Demand vs. capacity
The goal is not to collect more data, but to collect the right data. With clear metrics, teams can better pinpoint issues, validate root causes and make informed decisions.
Building capability: virtual metrics class
To support this work, UCLA Organizational Effectiveness and Development (OED) recently launched a virtual class, Making Metrics Meaningful for Yellow Belt–Certified Staff. The session focuses on selecting practical metrics, creating simple data collection plans and showing simple ways to display data to help guide decisions. This training is designed to make measurement approachable and actionable, helping staff integrate data into their everyday work.
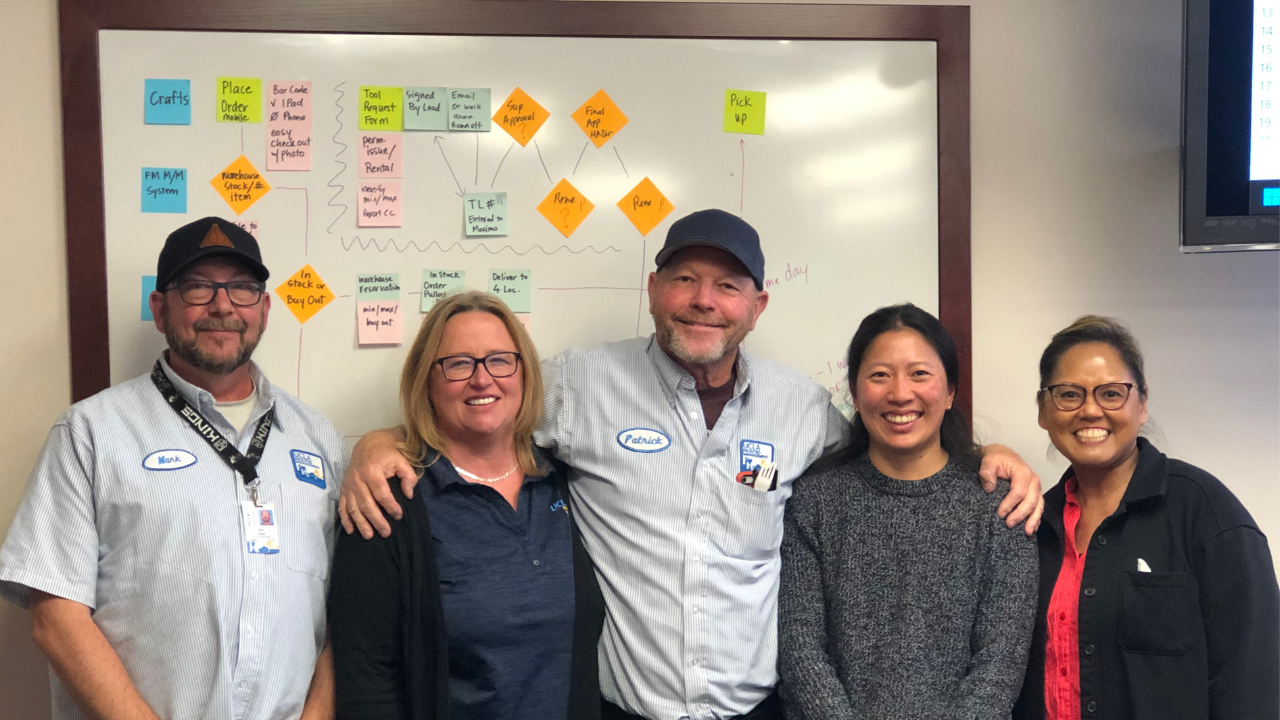
In practice: A team in Facilities Management, comprised of Mark Nyman, Karen Whitman, Patrick Doyle, Michelle Wang and Jo Anne Singer, shown in the photo above, recently completed a continuous process improvement (CPI) effort that illustrates how measurement, when paired with staff engagement, can create lasting improvement and a culture of continuous improvement.
Rather than focusing on isolated fixes, the materials management team used data to understand how their processes were performing, where breakdowns occurred and how changes affected technicians’ ability to do work. This focus on measuring what matters allowed the team to prioritize improvements that delivered real, visible impact.
Using metrics to see the current state and improve it
One early focus was warehouse inventory accuracy. By reviewing items that had not been ordered in five, 10 or even 20 years, the team identified more than 3,300 inactive items still listed as active inventory. With this baseline data, the team worked directly with shops to validate needs, update inventory statuses and remove clutter from both digital systems and physical space.
This effort not only streamlined warehouse operations but also ensured that stocked items more accurately reflected technician demand – an essential condition for reliable service delivery.
Measurement also played a key role in reducing out-of-stock items, a pain point frequently raised by technicians. Improved cycle counting, enabled by fixes to the inventory management iPad app, made it possible to track stock levels more accurately and replenish items proactively.
The result was clear: zero-balance warehouse items declined by approximately 88% in one quarter, dropping from 138 in January to 16 by March, demonstrating how consistent tracking can drive meaningful improvement.
Data supporting better decisions across the system
The CPI work extended beyond the warehouse. Purchasing processes were adjusted using data to identify delays caused by unclaimed materials at drop locations, prompting a new scan-and-report process that encourages timely pickup and accountability.
The team also analyzed special order data and identified frequently purchased items that made sense to stock regularly. Since mid-2024, more than 200 new items have been added to warehouse inventory, with 80-90% issued regularly, reducing wait times and unnecessary purchasing steps.
Perception as a performance measure
In addition to operational metrics, the team measured impact through a material management performance survey, comparing technician feedback from 2023 to 2025.
The results showed significant improvement across multiple measures, including inventory alignment with technician needs, ease of obtaining materials and overall perception of the materials management team.
These results demonstrate an important CPI principle: how customers experience a process is a metric too. Improved relationships, clearer communication and more reliable service are outcomes that matter, especially when validated with data.
A model for continuous process improvement
What makes this CPI effort stand out is not just the improvements themselves, but the mindset behind them. The materials management team continues to monitor key metrics, adjust processes and reinforce new ways of working through training and collaboration.
This approach, starting with clear questions, selecting practical metrics, testing changes and learning from results, creates a repeatable model that other teams can adopt. Measurement becomes not a one-time task, but a shared tool for learning, alignment and continuous improvement.
As other departments consider their own CPI efforts, the materials management experience shows that you don’t need complex dashboards to start. A small set of meaningful measures, paired with engaged staff and a willingness to learn, can deliver lasting results and help build a culture where improvement is simply “how we do our work.”
Start small
Measurement doesn’t need to be complex. Start with a few key questions:
- What problem are we trying to solve?
- What data will help us understand our current state?
- What does success look like?
- What data will communicate that success?
Even basic tools like a simple tracker or spreadsheet can provide valuable insight.